Treefall Risk Project

Note: Identifiable information has been removed and any figures have been changed to retain anonymity
At KaarbonTech I worked on a project for a Local Authority in the UK who were aiming to mitigate the risk of Ash Dieback within their region. Ash Dieback is a fungal disease affecting ash trees that is forecast to kill around 80% of ash trees within the UK over the coming years at a cost of around £15 billion. As the council has a duty of care to ensure public safety from the threat of treefall events caused by diseased trees, they wanted to perform a survey of their full highways tree inventory. However, due to time and budgetary constraints, as well as the complete lack of existent data held by the council regarding managed tree locations, a full inventory survey would not be possible for all trees. Therefore, the project involved using a risk-based approach to assessing road vulnerability and importance to focus the majority of resources towards roads that were of highest risk.
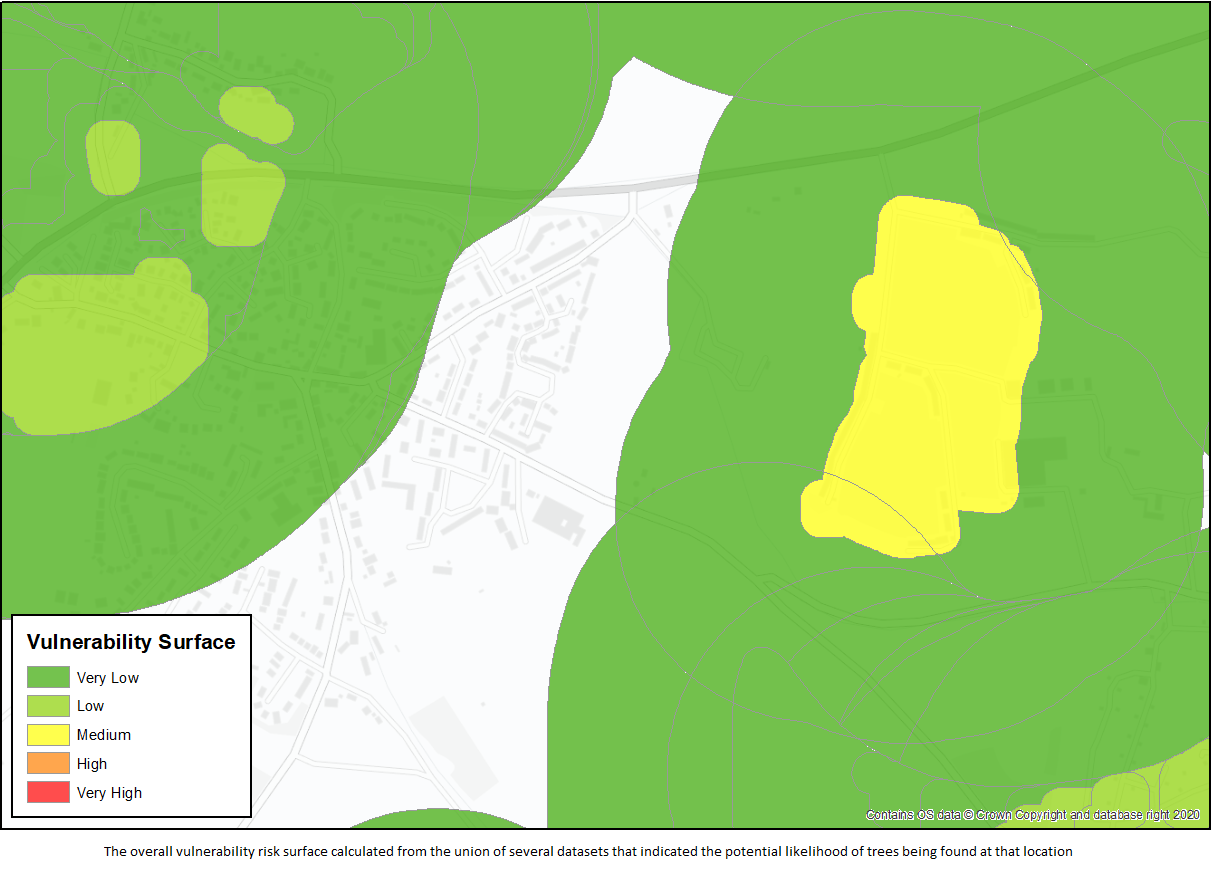
I obtained several open-source datasets from National England that would give some indication of the location of trees within the region. The data showed locations of ancient woodland inventories, habitat networks, nature reserves, areas of outstanding natural beauty and Great Crested Newt strategic opportunity areas. I weighted these datasets based on the likelihood of them correlating with real-world tree locations. I then combined the weighted datasets using the Union tool in ArcGIS to give an overall vulnerability risk surface indicating the likelihood at any one point of a treefall event occurring.
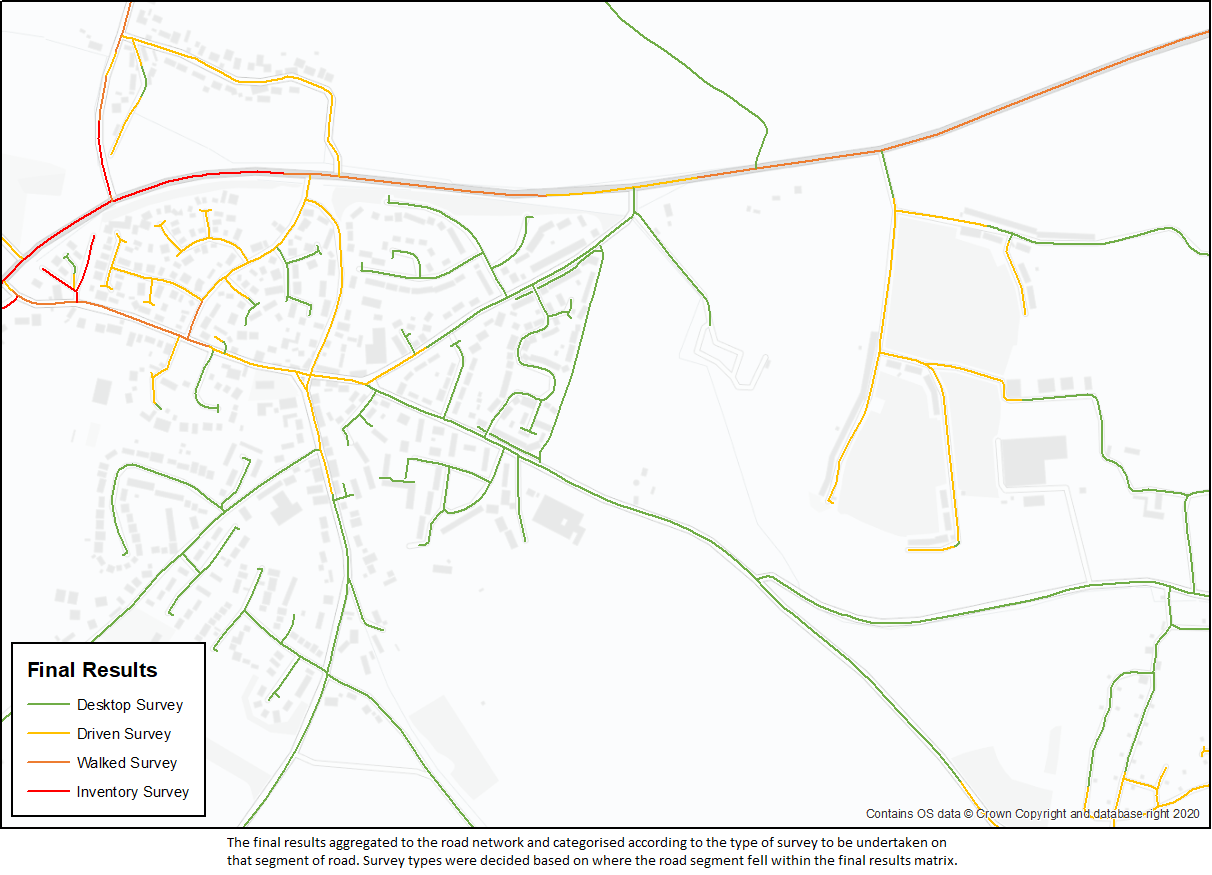
I obtained road data from the Local Authority containing information about their road hierarchy categories and urban/rural location. These fields were used to assign each road into one of five importance categories (from Very High to Very Low), with higher categories indicating roads where more damage would occur if a treefall event were to take place. I then segmented the road data using the boundaries of the vulnerability risk surface to give a vulnerability score for each section of road, then categorized the output into five risk categories, from Very High to Very Low.
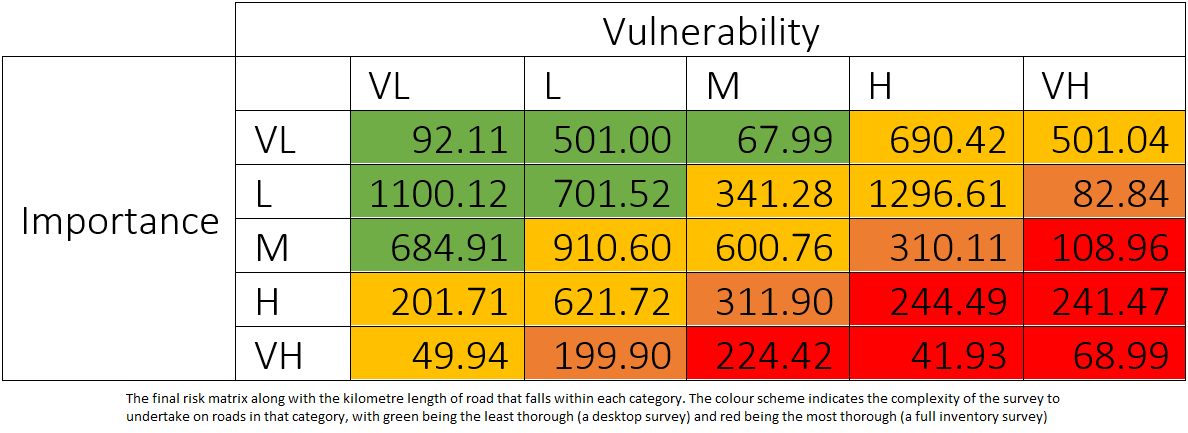
The output of the project was a risk matrix giving the total length of road that fell into each vulnerability and importance category. I then split the matrix into sections, with those in the highest combined risk sections being assigned the most in-depth inventory survey and those in lower risk categories being inspected less thoroughly.